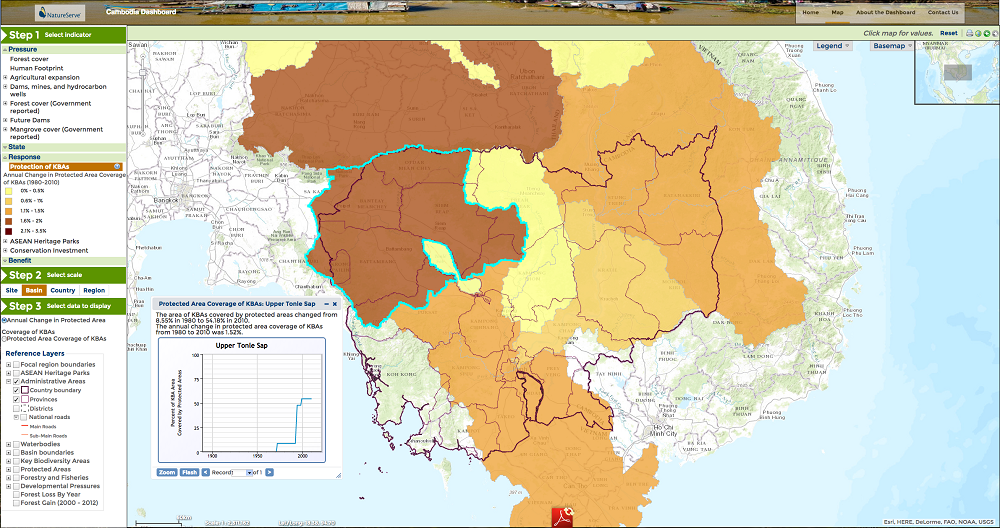
Why
Achieving global biodiversity goals relies on the ability to measure, visualize, and communicate both environmental trends and the effects of conservation actions. There is high demand for indicators of biodiversity status and trends at multiple spatial scales. But, easy, intuitive, and centralized access to biodiversity indicator data remains a challenge.
What
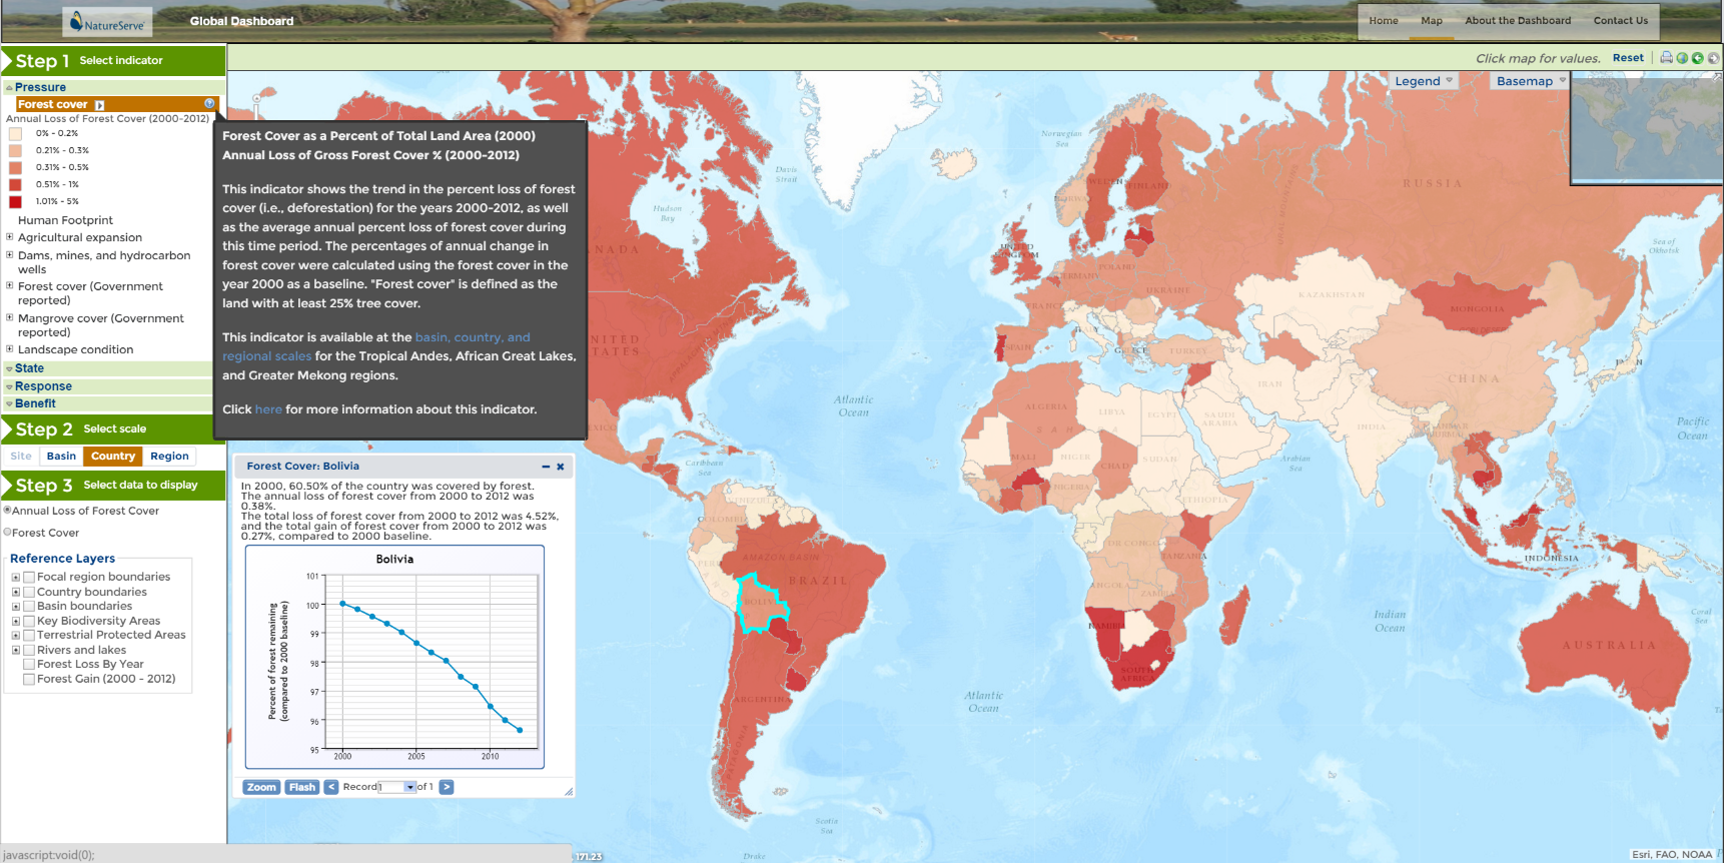 NatureServe’s Biodiversity Indicators Dashboard is an interactive tool that visualizes the health and trends of biodiversity, and tracks conservation performance at regional, national, basin, and site scales. The dashboard monitors the status of key biodiversity indicators for any part of the world, signaling both where and what conservation action is needed.
Dashboard can help track progress toward global conservation goals, support national monitoring and reporting, and inform outcome-based policy making for sustaining biodiversity.
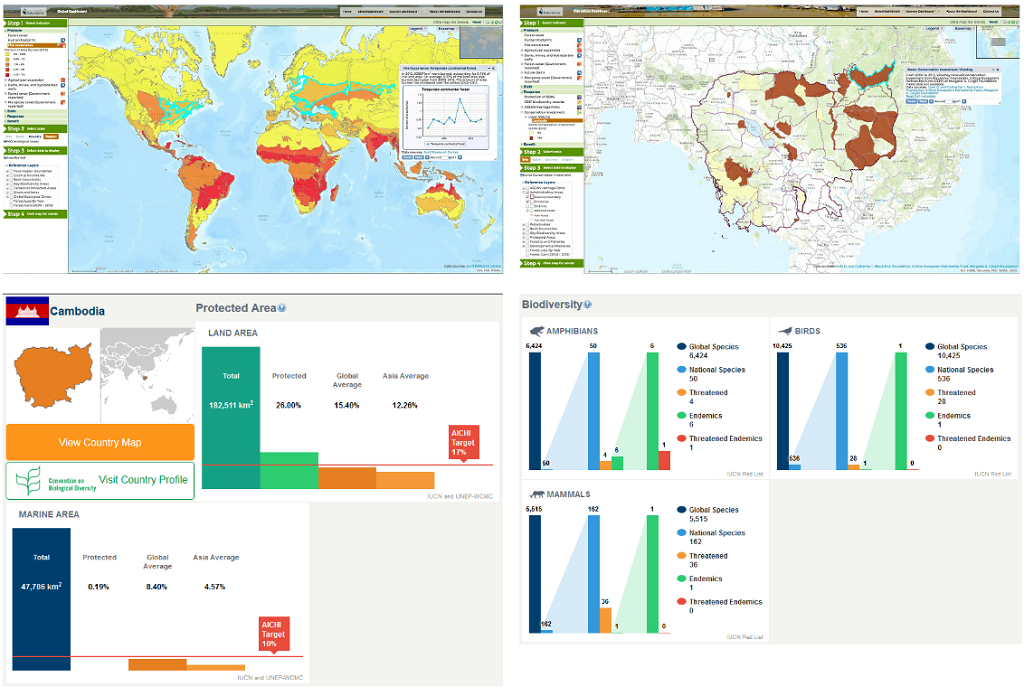 With just one tool, and a simple click of the mouse, you can:
- Visualize environmental and conservation trends of key biodiversity indicators
- Guide conservation decisions and actions
- Measure progress on conservation performance
- Learn the impact of conservation and environmental investments
- Inform outcome-based policy making
Dashboard in Action
At the request of the MacArthur Foundation, NatureServe used indicator data provided by the Dashboard to perform an analysis of the effectiveness of conservation efforts to prevent deforestation in eastern Cambodia.
The results showed that greater conservation investment resulted in lower rates of deforestation at the watershed level. Other factors, such as human population density, land protection status, existence of economic land and mining concessions, and the locations of planned dams were unrelated to deforestation rates over the nine-year study period. Thus, conservation investment is having a desired effect in eastern Cambodia, and more conservation benefits could be achieved by expanding the areas targeted for investment.
 Dozens of available unique biodiversity indicators to visualize.
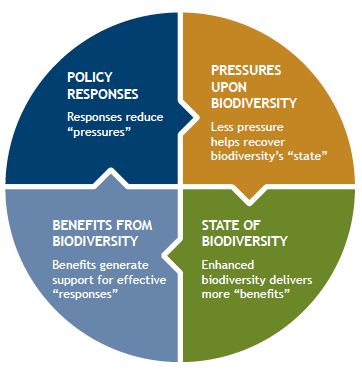
- Indicator categories include:
- Pressure: pressures human society puts on the state of ecosystem/biodiversity health (e.g. deforestation).
- State: status/health of ecosystems/biodiversity
- Benefit: benefits to human societies of improving the state of biodiversity health (e.g. freshwater provision)
- Response: action designed to reduce pressure and increase benefits
- Indicators are linked to the Aichi target they address, and are supported by comprehensive metadata.
- Multiple scale levels, including regional, national, basin, and site.
- Dashboard and maps available for specific countries.
- Interactive map includes legends, summary information on data, trend graphs, a variety of scale options and data to display
