Achieving global biodiversity goals relies on the ability to measure, visualize, and communicate both environmental trends and the effects of conservation actions. Answering these questions depends on the use of indicators and other evidence-based measurements to tell us about the health and integrity of biodiversity.
NatureServe’s Biodiversity Indicators Program oversees the development and use of indicators and provides support for building online tools to visualize biodiversity indicators. Fine scale indicators are developed to inform local decisions on the ground, such as determining the degree to which restoration or management practices are working. Broad scale indicators that aggregate information may be developed to report on and guide the benefits of national environmental policy and conservation investments. Visualization tools provide flexible access to the indicators for reporting, conservation and educational purposes.
Biodiversity indicators are also integral to tracking and informing progress on international, intergovernmental policy mandates, such as the Convention on Biological Diversity, amongst others. The data visualization tools developed under the Biodiversity Indicators Program, e.g., the BIP Dashboard, allows for exploration of progress in achieving the Aichi Biodiversity Targets of the Strategic Plan for Biodiversity 2011-2020. Users can also download visualizations of indicator trends at multiple spatial scales and use them for national reporting (e.g., 6th National Reports to the Convention on Biological Diversity).
These indicators can help us measure, monitor and predict:
a) Pressures or threats on biodiversity
b) The state of species and ecosystems
c) The conservation response
d) Benefits to people
There is a high and growing demand for indicators of biodiversity status and trends at multiple spatial scales. But, easy, intuitive, and centralized access to biodiversity indicator and spatial data remains a challenge.
Indicator Dashboards
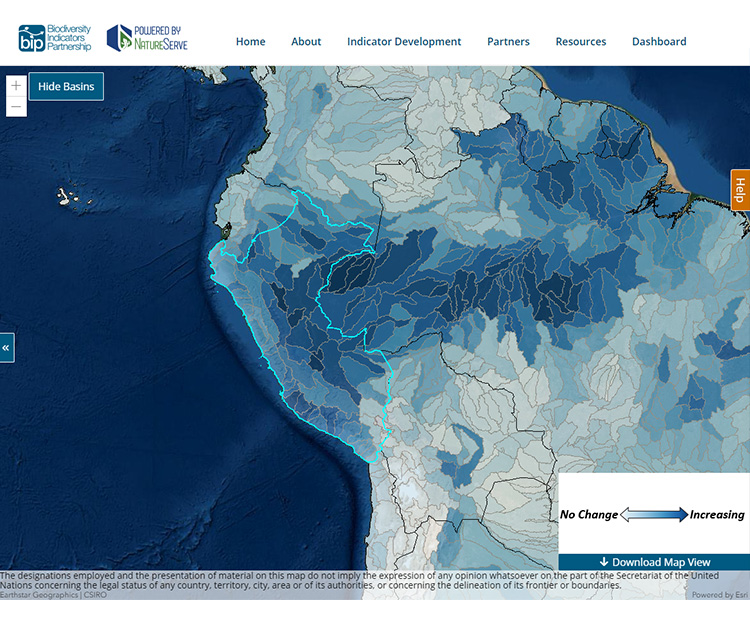
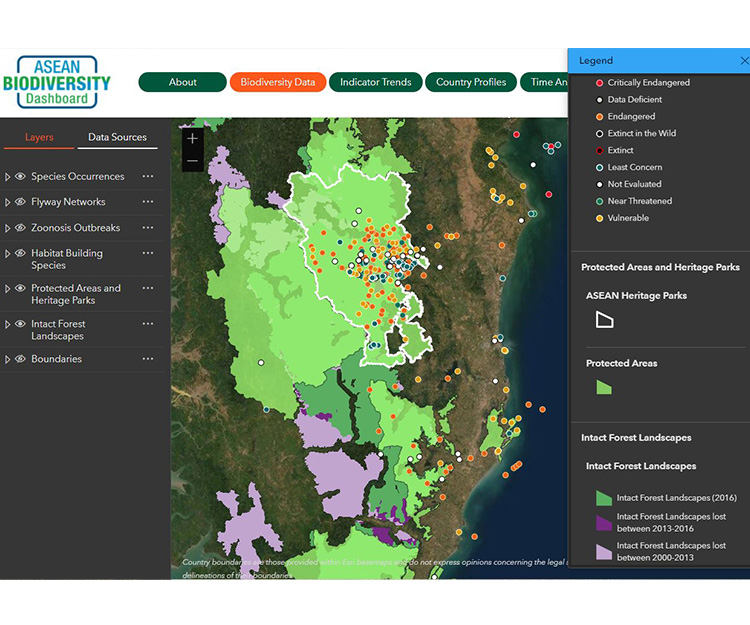
Dashboards are interactive tools that visualize the health and trends of biodiversity, and track conservation performance at regional, national, basin, and site scales. The dashboards monitor the status of key biodiversity indicators for any part of the world, signaling both where and what conservation action is needed.
With just one tool you can:
- Visualize environmental and conservation trends of key biodiversity indicators, spatial reference layers (e.g., intact forest landscapes) and point location data (e.g. species occurrences)
- Guide conservation decisions and actions
- Measure progress on conservation performance
- Learn about the impact of conservation and environmental investments
- Inform outcome-based policy making