Last year, in collaboration with the UN Environment World Conservation Monitoring Centre and the global Biodiversity Indicators Partnership (BIP), NatureServe launched the BIP Dashboard, a game-changing, interactive online tool that visualizes trends over time in critical indicators of biodiversity and ecosystem health.
Indicators, or evidence-based measurements, allow us to assess the health and integrity of biodiversity and identify trends across time and space. For many years, NatureServe’s Biodiversity Indicators Program has advised users at multiple levels—from global policy forums such as the Convention on Biological Diversity, to national and regional governments, to organizations working at a local scale—on how best to use data driven, scientific indicators to measure progress toward their conservation milestones and targets.
Unfortunately, a recent United Nations report concluded that we are not yet on track to meet the biodiversity goals for conserving nature and achieving sustainability set for 2020 and beyond. The BIP Dashboard is being actively used by policy-makers around the world to adjust course to meet those goals. The Dashboard provides a central access point to trustworthy, scalable biodiversity data that is used to track and report on national and global progress. Using the latest advances in information technology and data visualization, the Dashboard’s dynamic map allows users to customize indicator visualizations at any scale—globally, nationally, within specific watersheds—with the click of a button. Users can export data and graphs for reporting under multilateral environmental agreements like the Convention on Biological Diversity. In fact, many nations used the Dashboard last year to help prepare their national status reports to the Convention.
Indicators included in the BIP Dashboard help us measure, monitor, and predict pressures or threats to biodiversity and ecosystem health. They also inform and evaluate our conservation efforts and measure the benefits of those actions to human communities.
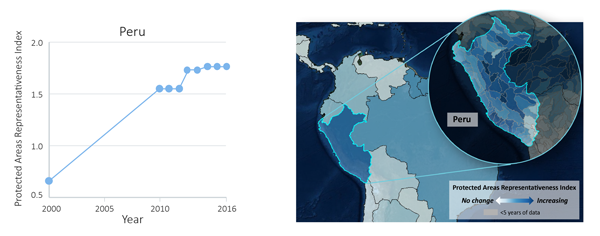
The Protected Area Representativeness Index, for example, measures the degree to which a protected area adequately encompasses the full diversity of habitats and ecosystems in a given region, helping planners select new proposed areas or modify the borders of existing ones. The trend line graph below shows that between 2000 and 2016, Peru greatly improved the degree to which its protected areas represent the nation’s biodiversity, with the largest gains in 2010 and 2012. The finer-scale country map shows which areas have contributed most to those improvements, and the regional map compares Peru’s progress to other countries.
Also in the past year, NatureServe began working with partners in Southeast Asia and the Tropical Andes to apply our visualization tools and technology to create new dashboards for these regions. These dashboards help decision-makers visualize trends and achievements in user-friendly formats to facilitate more forward-looking, responsible conservation action.
2020 promises to be a busy and exciting year for the Biodiversity Indicators Program. We have extended our partnership with the World Conservation Monitoring Centre and are working to develop a new global Target Tracker that will equip policy-makers with information about the latest trends and emerging issues to inform more effective and timely conservation action. The Target Tracker will directly serve the next phase of the Convention on Biological Diversity, transforming the current backward-looking reporting and assessment process to a continuous, forward-looking process that improves transparency and produces better outcomes for biodiversity.
This story is featured in NatureServe's 2019 Annual Report.