The “Coarse filter/fine filter” Approach to Conservation
By recognizing and conserving all natural types of ecosystems, we conserve the natural setting for species to survive and evolve. A focus on ecosystem diversity provides a “coarse filter” for conserving biodiversity, enabling us on the one hand to “keep common species common” but then focus on a subset of species that require specialized attention (i.e., the “fine filter”). Therefore, documenting changes in ecosystem extent and protection is essential to understanding status of biodiversity and related ecosystem services.
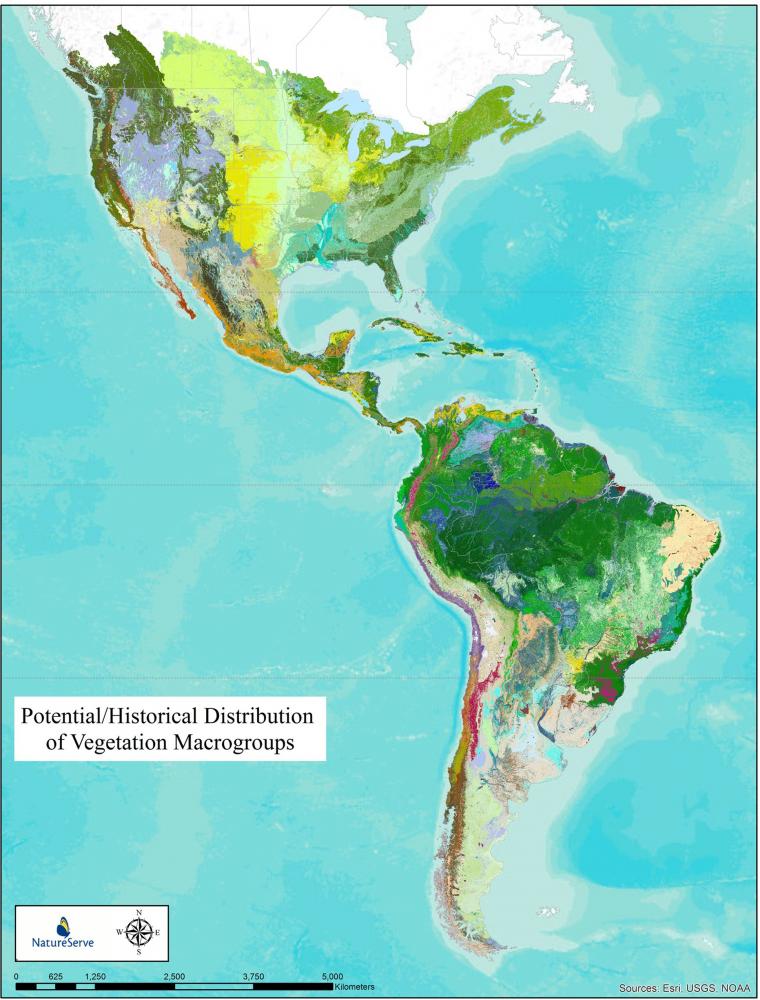
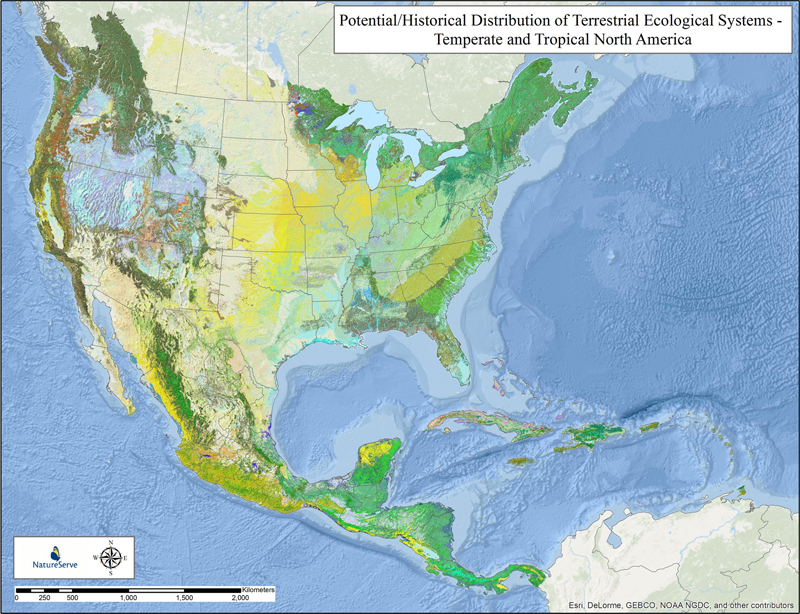
We developed both potential/historical vs. current distribution maps of upland and wetland ecosystem types for the temperate and tropical Americas. We used a hierarchical classification to describe and map natural ecosystem types at six levels of thematic detail. Results are summarized here at two levels, with 315 vegetation macrogroups mapped across the hemisphere (excluding boreal and arctic North America) and for 624 NatureServe terrestrial ecological systems in North America and Caribbean.
Historically, Forest and Woodland vegetation macrogroups encompassed 55.3% of the area, with Tropical forests encompassing 30.3% and Temperate forests 25%. Shrubland and Grassland vegetation classes extended over 28.6%, with most (17%) as Cool Semi-Desert Scrub and Grassland. Desert & Semi-Desert extended over 14.1% of this area, split almost evenly between warm and cool desert types. The overall potential extent of macrogroup types across the study area varied from a maximum of 2,211,332 km2 for Great Plains Mixedgrass & Fescue Prairie down to 13 types that each had <1,000 km2.
In North America and Caribbean, the historical extent of Forest and Woodland ecological systems encompassed 54.6% of the area, with Tropical forests encompassing 11.2% and Temperate forests 43.4%. Shrubland and Grassland systems extended over 25.3%, with most (20.9%) as Cool Semi-Desert Scrub and Grassland. Desert & Semi-Desert extended over 19.1% of the study area, split almost evenly between warm (10.2%) and cool (8.9%) desert types. The overall potential extent of ecological system types in North America and Caribbean varied from a maximum of 620,875 km2 for Northwestern Great Plains Mixedgrass Prairie down to 211 types, each with <1,000 km2.
In North America and Caribbean, the historical extent of Forest and Woodland ecological systems encompassed 54.6% of the area, with Tropical forests encompassing 11.2% and Temperate forests 43.4%. Shrubland and Grassland systems extended over 25.3%, with most (20.9%) as Cool Semi-Desert Scrub and Grassland. Desert & Semi-Desert extended over 19.1% of the study area, split almost evenly between warm (10.2%) and cool (8.9%) desert types. The overall potential extent of ecological system types in North America and Caribbean varied from a maximum of 620,875 km2 for Northwestern Great Plains Mixedgrass Prairie down to 211 types, each with <1,000 km2.
Five vegetation macrogroups (1.6%) scored in the >90% loss category (Fig 1). These included temperate grasslands from North America, such as the Central Lowlands Tallgrass Prairie and the Californian Annual & Perennial Grassland. Fifteen types (4.8%) scored in the 70-90% loss category. These included additional temperate grasslands in South America, such as the Humid Pampas Grassland, Parana Upland Savanna. They also include forest and savanna types in North America, such as the Central Midwest Oak Forest, Woodland & Savanna, and the Southeastern Coastal Plain Evergreen Oak - Mixed Hardwood Forest. Forty-six types (14.6%) scored in the 50-70% loss category. Among many other types, these included the Cerrado Savanna, Atlantic, Cerrado, and Caatinga Seasonal Dry Forests of Brazil, and the Brazilian Atlantic Humid Forest. In North America, this category includes Longleaf Pine Woodland in the southeastern United States, the Central Midwest Mesic Forest, and Great Plains Mixedgrass & Fescue Prairie.
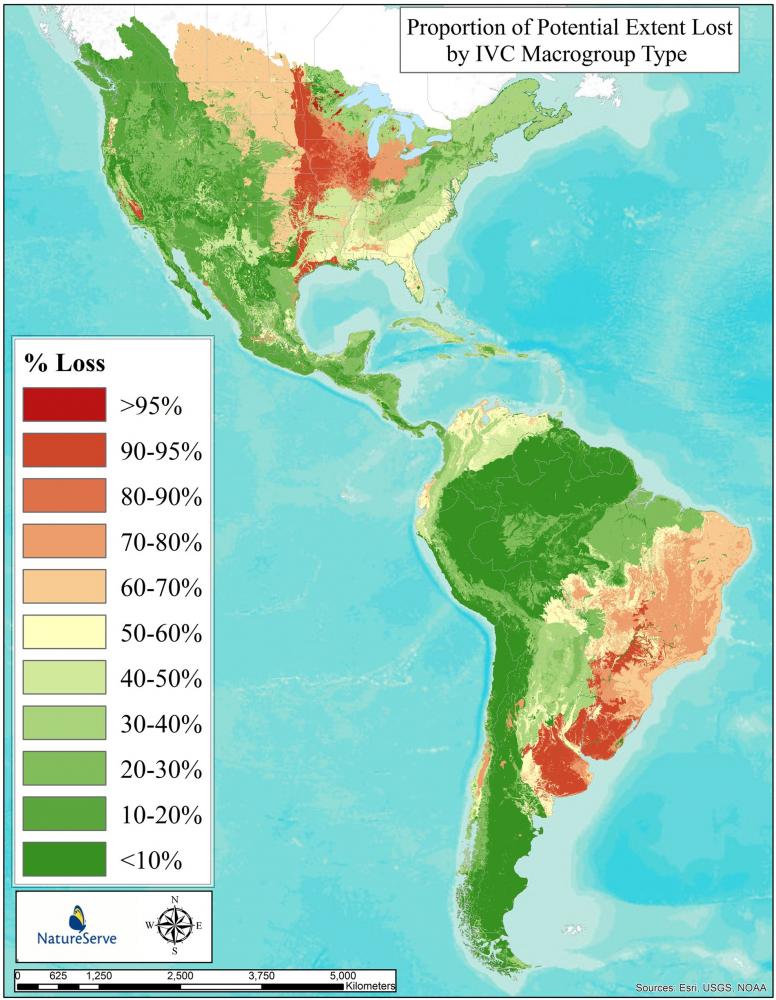
The IUCN Red List of Ecosystem criteria for long-term reduction in distribution include three thresholds for scoring types as Vulnerable (>50%), Endangered (>70%), or Critically Endangered (>90%). Applying these thresholds, fully 66 macrogroups (20.9%) score within Red List categories of CR, EN, or VU.
For 433 North American ecological systems assessed, 31 types (7.1%) scored in the >90% loss category (Fig 2). These included temperate grasslands from North America, such as the Northern Tallgrass Prairie, North-Central Interior Oak Savanna, Texas Blackland Tallgrass Prairie, East Gulf Coastal Plain Interior Upland Longleaf Pine Woodland, Mississippi River Low Floodplain (Bottomland) Forest, Columbia Basin Palouse Prairie, and California Central Valley Mixed Oak Savanna. Forty-seven types (10.8%) scored in the 70-90% loss category. These included additional temperate grasslands, forest and woodland types, such as the Northern Great Plains Fescue-Mixed Grass Prairie, Great Lakes Wet-Mesic Lakeplain Prairie, North-Central Interior Beech-Maple Forest, and Southeastern Interior Longleaf Pine Woodland.
Sixty-three types (14.5%) scored in the 50-70% loss category. Among many other types, these included the Northwestern Great Plains Mixedgrass Prairie, Central Mixedgrass Prairie, Southern Piedmont Dry Oak-(Pine) Forest and Woodland, Allegheny-Cumberland Dry Oak Forest and Woodland, North-Central Interior Floodplain, and Guerreran Savanna in south-central Mexico.
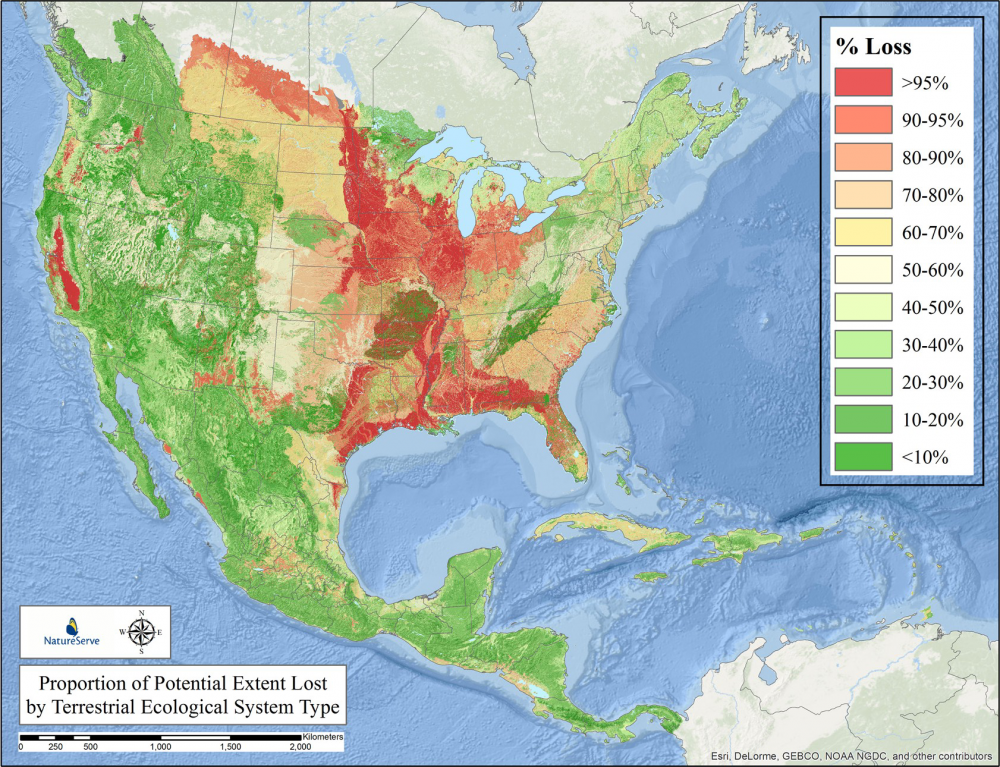
Again, given IUCN Red List of Ecosystem criteria for long-term reduction in distribution, fully 141 ecological systems (32.5%) score within Red List categories of CR, EN, or VU.
Current Ecosystem Protection
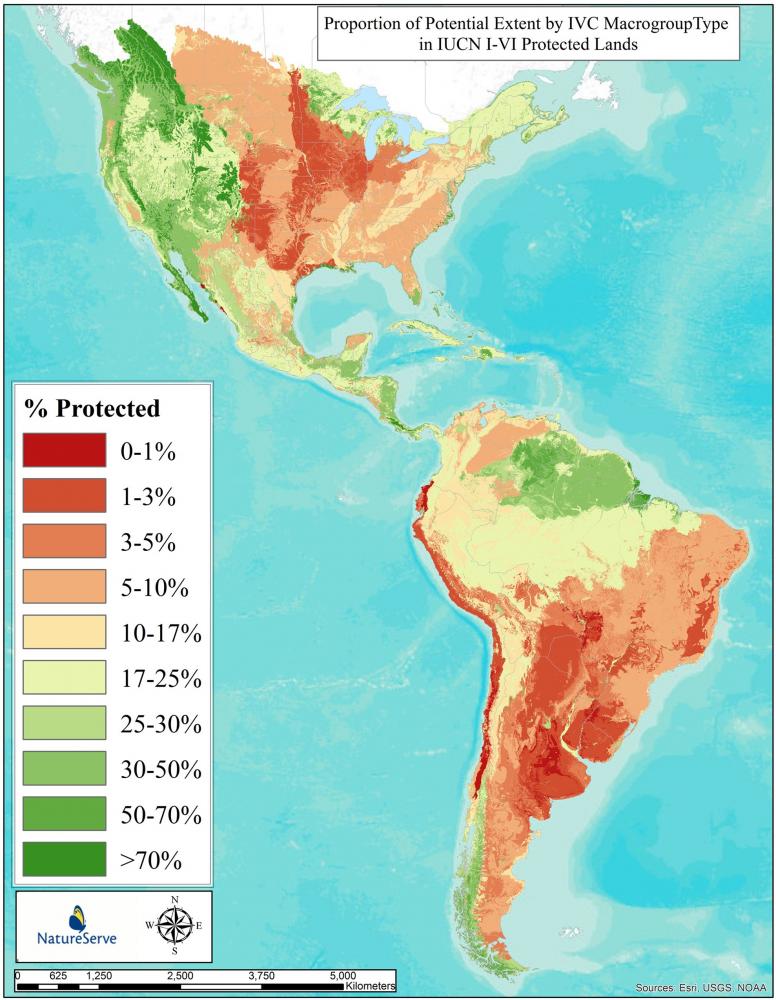
The proportional historic extent currently protected for macrogroups in North and South America varies across the continental geography (Fig 3). Some 41 macrogroup types (13%) scored in the >50% protected category. Eleven types (11%) scored in the 30-50% protected category. Sixty-seven types (21.3%) scored in the 17-30% protected category. Forty-four types (14%) scored in the 10-17% protected category. These include Appalachian-Northeastern Oak - Hardwood – Pine Forest & Woodland, Western Amazon Lowland Humid Forest, and Guajiran Seasonal Dry Forest.
Overall, 111 types (45.3%) scored at or above the 17% protection category, as described by Aichi Target 11 of the Convention on Biodiversity. On the other hand, fully 128 types (40.6%) have less than 10% of their potential extent represented in protected areas. Therefore, as measured through vegetation macrogroups, there appears to be substantial work yet to be done to achieve the intended 2020 target in the Americas.
Fifty-five types (17.4%) scored in the 5-10% protected category. These include Great Plains Mixedgrass & Fescue Prairie, Southern & South-Central Oak – Pine Forest & Woodland, Cerrado Savanna, Caatinga Seasonal Dry Forest, and Patagonian Dry Grassland & Shrubland. Thirty-three types (10.5%) were in the 3-5% protected category. Twenty-eight (8.8%) were in the 1-3% protected category, and 12 types (3.8%) scored in the 0-1% protected category.
Fifty-five types (17.4%) scored in the 5-10% protected category. These include Great Plains Mixedgrass & Fescue Prairie, Southern & South-Central Oak – Pine Forest & Woodland, Cerrado Savanna, Caatinga Seasonal Dry Forest, and Patagonian Dry Grassland & Shrubland. Thirty-three types (10.5%) were in the 3-5% protected category. Twenty-eight (8.8%) were in the 1-3% protected category, and 12 types (3.8%) scored in the 0-1% protected category.
Among the most extensive types in this unprotected category are concentrated in the Southern Cone of South America, including Pampean Freshwater Marsh, Wet Meadow & Shrubland, Espinal Deciduous Forest & Woodland, Pantanal Floodplain Forest, Chilean Mediterranean Sclerophyllous Forest, Western Ecuadorian Humid Forest, and Southern Chaco Xeromorphic Scrub & Savanna.
The proportional historic extent currently protected for 433 assessed ecological system types in North America and the Caribbean also varied across the continental geography (Fig 4). Some 13 system types (5.3%) scored in the >50% protected category. Thirty-five types (8.9%) scored in the 30-50% protected category. Sixty-seven types (15.4%) scored in the 17-30% protected category. Eighty types (18.4%) scored in the 10-17% protected category. These include Meso-American Premontane Semi-deciduous Forest, Sonoran Paloverde-Mixed Cacti Desert Scrub, Madrean Lower Montane Pine-Oak Forest and Woodland, and Caribbean Wet Submontane/Lowland Forest.
Overall, 125 types (28.8%) scored at or above the 17% protection category, as described by Aichi Target 11 of the Convention on Biodiversity. On the other hand, fully 229 types (52.7%) have less than 10% of their potential extent represented in protected areas. Similar to results for macrogroups on a hemispheric scale, if measured through ecological systems, there appears to be substantial work yet to be done to achieve the intended 2020 target in North America.
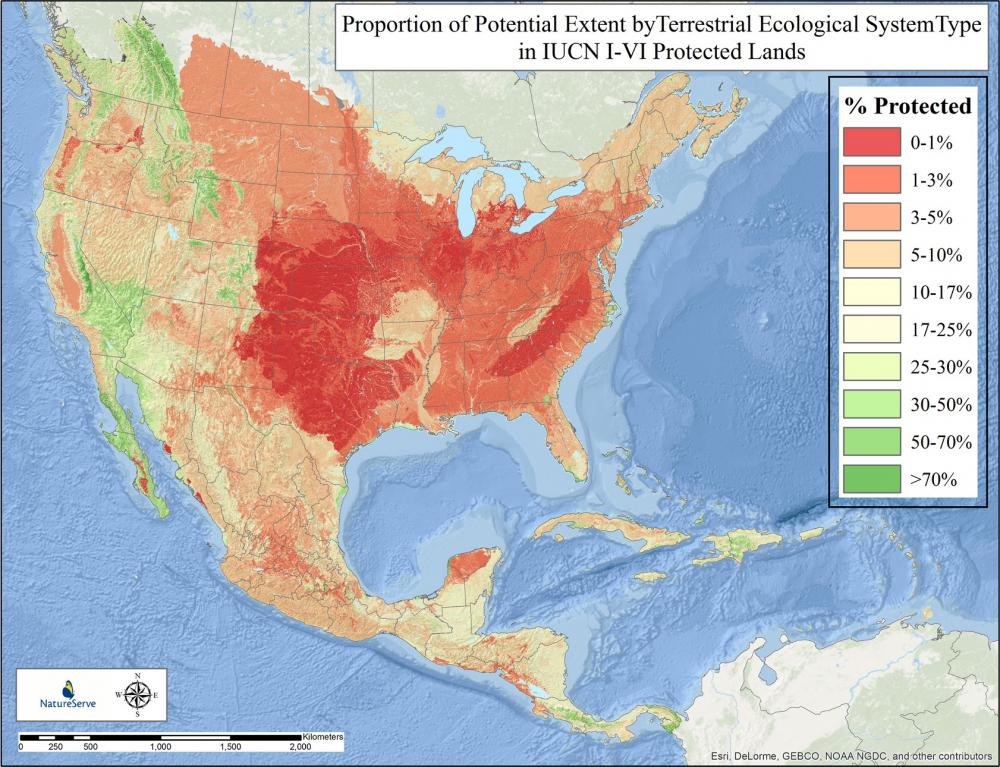
Ninety-three types (21.4%) scored in the 5-10% protected category. These include Inter-Mountain Basins Big Sagebrush Shrubland, Laurentian-Acadian Northern Hardwood Forest, Guerreran Dry Deciduous Forest, Sinaloan Dry Deciduous Forest, and Mexican Upper Montane Pine-Oak Forest and Woodland. Forty-three types (9.9%) were in the 3-5% protected category. Seventy types (16.1%) were in the 1-3% protected category.
Twenty-three types (5.3%) scored in the 0-1% protected category. These include Southeastern Great Plains Tallgrass Prairie, Southern Piedmont Dry Oak-(Pine) Forest and Woodland, North-Central Interior Beech-Maple Forest, Texas Blackland Tallgrass Prairie, and East Gulf Coastal Plain Jackson Plain Prairie and Barrens.
This effort in the Americas - encompassing 22% of the global land surface - demonstrates methods and outputs suitable for worldwide application at continental scales. These maps and analyses allow us to rigorously assess our progress under international agreements, such as the Convention on Biological Diversity (CBD), or for scoring relative status of types under the IUCN Red List of Ecosystems. Overall, ecosystem diversity measures are key component of what are now considered Essential Biodiversity Variables (EBVs) for global ecosystem assessment. In particular, EBVs for Ecosystem Structure (Ecosystem Distribution) and Community Composition (Functional Diversity) could be supported with these data.
Here we provide a benchmark for approximating potential or pre-industrial historical extent of most terrestrial ecosystems across much of the Americas. The “potential” distribution maps cannot fully account for the vagaries of human population densities and land uses in concentrated areas throughout the Holocene, but can provide one input to these estimates, and these estimates could be especially meaningful for ecosystem types that have been severely converted or degraded in recent centuries.
As compared with analogous global efforts, we used data of substantially finer thematic and spatial resolution. We therefore provide much greater relative detail and reliability in our estimates. This study clearly shows that, over the past several centuries, ecosystem conversion has been concentrated in most agriculturally productive and accessible lands throughout the hemisphere. These include severe and concentrated loss of temperate grasslands in both North America, and the South American Pampas, as well as for forests and woodlands across the eastern USA and Brazil’s Atlantic Forests and Cerrado, most tropical dry forests, and coastal woodlands and shrublands of Chile.
One of our primary contributions here is standardized classification and description of terrestrial ecosystems on a hemispheric scale, and a set of maps that match those standards. Providing a complement to prior efforts that may have been more anecdotal, qualitative, and/or limited to political jurisdiction, we now have a mapped basis and quantitative measures for a large proportion of recognized ecosystem types across the hemisphere. In effect, for the first time, we have a “common currency” for describing status and trend in terrestrial ecosystems that harmonized concepts across political jurisdictions and is readily linked to emerging global standards.
Our approach – utilizing hierarchically structured ecological classification - brings flexibility for application to a range of conservation-related decision-making processes. For example, the IVC macrogroup level (along with higher levels of the hierarchy) may be completely appropriate for defining and global tracking of Essential Biodiversity Variables. Meanwhile, finer levels of classification, as illustrated here with ecological systems, are more likely suitable for IUCN ecosystem red listing, as well as for carrying forward into ecosystem restoration on the ground.
Ecosystem Protection
These maps should provide increasingly precise direction as to where conservation actions could be concentrated to ensure adequate representation of ecological diversity. With some 41% of macrogroups and 53% of ecological systems occurring with <10% under formal protective status, we are substantially underachieving the 17% goal set out under CBD Aichi target 11. This finding should directly inform post-2020 targets under the Convention on Biological Diversity.
Importantly, this measure captures proportion of the potential extent currently protected, as opposed to simply considering the proportion of current extent currently protected, as is common in many “gap analysis” efforts. This is of particular interest where high rates of ecosystem conversion have already occurred and there is a desire to report on relative protection status ecosystem diversity under CBD Aichi target 11. There, recommendations to protect “at least 17%” of representative and connected ecosystems might be rigorously addressed using both potential and current distribution maps for terrestrial ecosystem types.
These same data may be combined with others depicting human footprint information to better indicate where current extent of ecosystems is more or less likely to be in poor condition and to indicate trends in ecosystem degradation.
Conclusion
We hope that the rich text, tabular, and map data set accompanying this study provide a foundation for deepened analysis and conservation action across the Americas.
Several related pages elsewhere on NatureServe.org:
Primer on ecological classification generally, and the international vegetation classification.
Background and current ecosystem and land cover map of the United States
Background on classification in Latin America and Caribbean
NatureServe’s work on the IUCN Red List of Ecosystems
Access PLOS ONE publication here.
Text Appendices
- Mapping Methods
- Classification and descriptions of North America - Potential extent 624 terrestrial ecological systems
- Classification and descriptions of North and South America - Potential extent 315 vegetation macrogroups
Tabular Summaries
- North America - map codes, names, links to vegetation hierarchy, map validations statistics, loss statics, protection statistics for 624 terrestrial ecological systems
- North and South America - map codes, names, links to vegetation hierarchy, map validations statistics, loss statics, protection statistics for 315 vegetation macrogroups
Map Products
- North America - Potential extent of 624 terrestrial ecological systems
- North America - % Loss of potential extent of 433 terrestrial ecological systems
- North America - % of potential extent found within IUCN protected status I-VI land for 433 terrestrial ecological systems
- North America - Current extent of 624 terrestrial ecological systems
- North and South America - Potential extent of 315 vegetation macrogroups
- North and South America - Current extent of 315 vegetation macrogroups
- North and South America - % Loss of potential extent of 315 vegetation macrogroups
- North and South America - % of potential extent found within IUCN protected status I-VI land for 315 vegetation macrogroups
View maps online here.
Download text, tabular, and map products here.